Intro Note
This is a blog post I wrote back at my previous job in September of 2018 to submit to VMware and NetApp after a pretty nasty issue we had with horrendous disk latency with the combination of NetApp SolidFire and it’s QoS Policies with vVols. Back then, I never had anywhere to post it. Now that I have my site, I figured it would be a good thing to publish retroactively.
As far as I know, this is still an issue, but if it’s not, there is still some really great troubleshooting information in this post that would be valuable to have out there in the world. I’d love if some of my VMware or NetApp friends would run across this and help close the loop on some of the lingering questions we had at the bottom of the post, which, at the time of my leaving my previous job, we had not nailed down.
Also - special shout out goes to my team who helped work through a lot of this. If you guys read this and want your name mentioned, just let me know :)
Overview of the Problem
Several weeks ago, users of our platform started reporting periodic issues with what appeared to be high latencies on the storage we had allocated to a VMware based environment. They frequently reported latencies in the 300-400 ms range, which is significantly higher than the 3-4 ms latency we advertised.
Because of our use of IOPS QoS policies (more below) we assumed that the user had maxed out their IOPS policy. However, we quickly realized the QoS policy was actually artificially introducing the noisy neighbor problem, and all VM’s on the hypervisor (at least the ones we looked at) were experiencing high disk latencies by just a single VM exceeding their QoS policy. By trying to solve the noisy neighbor problem, it appeared that we actually made it 10x worse. On a cluster that was capable of doing over 200k IOPS, a single user doing 3000 4k IOPS was able to impact performance for all other VM’s on the host, despite the storage barely being utilized.
To summarize, we had 2 problems:
- A single user was maxing out their QoS policy (identified by problem #2). I’ll refer to this as the “Bad Neighbor” VM going forward.
- All VM’s on the host that where a single VM had maxed out it’s IOPS policy VM were experiencing high disk latencies (300-400 ms). I’ll reference to this as the “Good Neighbor” going forward.
The Environment
The storage technology is NetApp SolidFire, which is an all-flash based software defined storage, which provides the capability to provide a minimum, maximum, and burst level of IOPS on a per volume setting. Traditionally in a VMware environment, this would mean that you would be able to set QoS policies on the LUN that is presented for an entire datastore, and the aggregate of all VM’s on that datastore would receive the QoS policies.
However, couple this with VMware vVols and you have the ability for each VM “disk” to be a virtual volume on the SolidFire cluster. In our environment, we implemented this to prevent “noisy neighbor” situations in which a single VM (or a few) could consume all the available IOPS for a given host/cluster/array.
In order to give our consumers options, we built 3 tiers of storage using SPBM profiles in vCenter:
| QoS Policy | Min IOPS | Max IOPS | Burst IOPS |
|---|---|---|---|
| Bronze | 25 | 1000 | 2000 |
| Silver | 50 | 1500 | 3000 |
| Gold | 100 | 3000 | 6000 |
The storage was presented to ESXi clusters over iSCSI, but was not currently set up with multi-pathing because:
- We only have 2 10GB NICs, and multi-pathing appears to require dedicated NICS for ESXi
- Our iSCSI initiator and targets are in different subnets, which does not appear to be supported by iSCSI port binding
Additionally, no extra tuning had been performed. All settings on VMware were out of the box.
Troubleshooting
We quickly found that by migrating the “Good Neighbor” VM off the hypervisor, the issue went away for that VM. However, it wasn’t immediately apparent which VM was causing the problem. We looked at all VM’s and who was consuming the most IOPS, but we didn’t see anything that was nearing a 2000-3000 max we had defined, so we kept searching.
In the meantime, another user reported the same issue to us, so we started looking in to their VM. Assuming it was the same issue, we moved it to another hypervisor. However, this time, it did not resolve the issue. We then looked at the IOPS and noted that it was rather low and not hitting the QoS Policies. We took a peak at what VMware was reporting the average block size of read/writes was, and noted it was doing an average of 512k block writes. The total IOPS was not significant, so we weren’t too concerned about it being a QoS policy at this point.
After a bit of testing with FIO, we realized (which we knew, but just had forgotten) that the SolidFire QoS policies scale with the block size. In other words, a 6000 IOPs burst policy is defined at the 4k block size level. When you go up to a 262k block size, it’s only 154 IOPS:
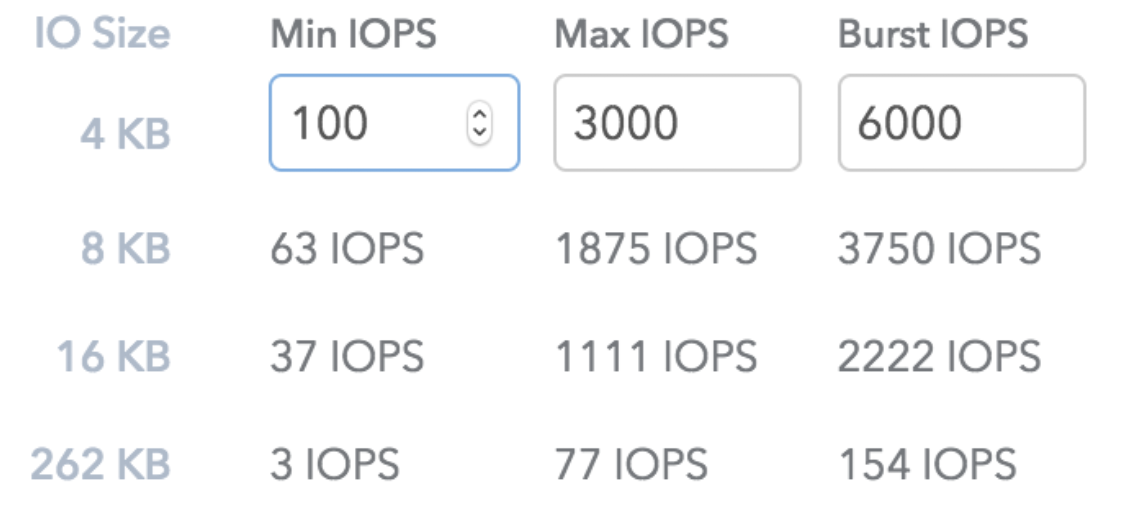
The “bad neighbor” VM had selected a bronze tier of storage, which granted them 2000 burst IOPS at 4k block size, which is somewhere around 25 IOPS at 512k block size. Increasing their QoS policy to gold brought their performance inline with what they expected from a previous environment. Great, problem #1 solved.
What about problem #2 though? A bad neighbor exceeding their QoS policy should not be able to impact other VM’s on the same hypervisor.
Replicating the problem
The first thing we aimed to do was to be able to recreate the problem. To do this, we went to our lab, which consisted of a single node SolidFire “cluster”.
We created two VM’s on a single hypervisor, on the same datastore, and used FIO and IOPING to attempt to recreate.
All the testing we had done on this had been around small block sizes. On VM A, we ran the following FIO command:
fio --name=randwrite --ioengine=libaio --iodepth=1 --rw=randwrite --bs=4k --direct=1 --size=512MB --numjobs=1 --runtime=600 --unlink=0
Then, on VM B, we ran the following IOPING command:
ioping -c 100 .
This was unsuccessful recreated the problem despite hitting the max QoS policy.
Then, we jumped to a 512k block size with FIO:
fio --name=randwrite --ioengine=libaio --iodepth=1 --rw=randwrite --bs=512k --direct=1 --size=512MB --numjobs=1 --runtime=600 --unlink=0
Again, we were still unsuccessful at replicating. Then, we ramped up the iodepth and number of jobs:
fio --name=randwrite --ioengine=libaio --iodepth=8 --rw=randwrite --bs=512k --direct=1 --size=512MB --numjobs=5 --runtime=600 --unlink=0
Bingo!
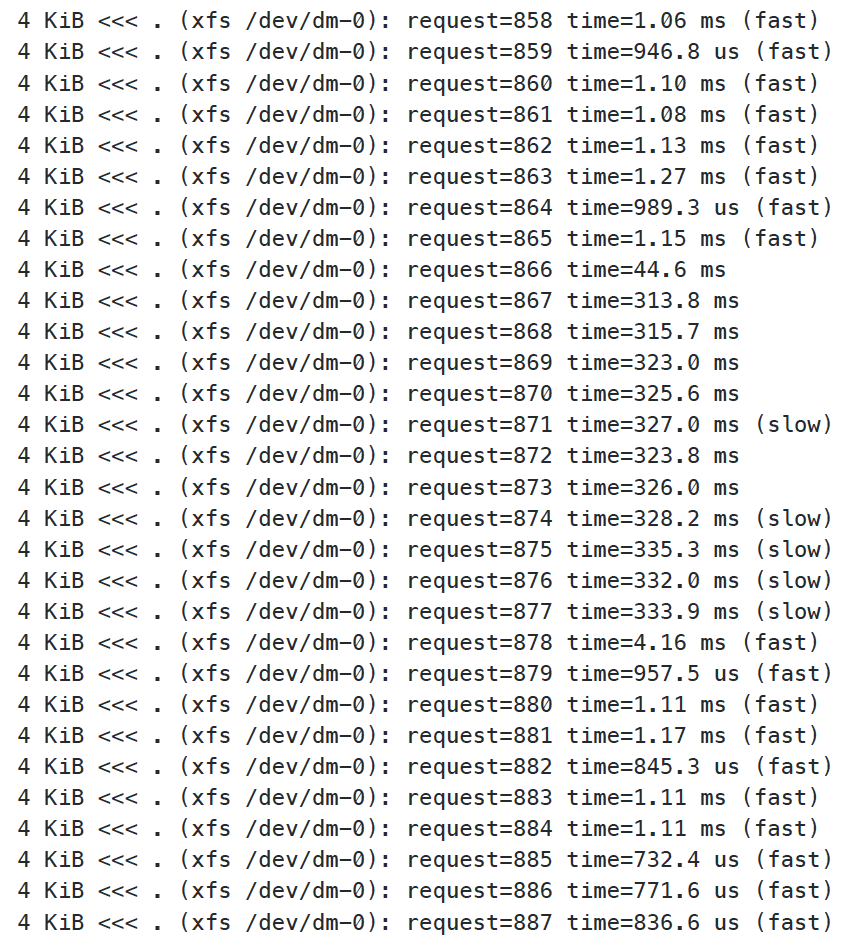
It’s very obvious where we started the FIO test, and now we can replicate independently, without having to ask our end users to do it. In my opinion, this should always be the first step in fixing a problem. There is nothing worse than going back and forth with a consumer of your platform asking “Can you test again to see if that fixed it?” I never felt that portrayed much confidence in your platform, and I try to avoid it all costs.
Isolating Variables
When approaching a problem such as this, the first thing I always like to focus on is isolating the variables, so you can get down to the simplest workflow, with the fewest number of things that could be causing the issue.
From the highest level, we had 3 variables to work through:
- Compute (ESXi)
- Network
- Storage (SolidFire)
However, given the simplicity in which we recreated the issue, we were almost certain that it wouldn’t have been just one of those three. After all, if it was, how has nobody ran in to this before?
So, let’s look at how we isolated each high level variable.
Networking
Right, wrong, or indifferent, networking is always the first thing blamed, and this was no different. After some thinking, we decided to give cabling a single ESXi host up directly to a SolidFire appliance (no switch in between) taking all the network gear out of the equation a shot. To our surprise, we were able to replicate the problem immediately. Network was ruled out as a suspect.
Storage
Storage was pretty much isolated right off the bat. We knew that if the two VM’s were on different hypervisors, the problem did not persist. This, for the most part told us it wasn’t an issue on the storage. This was further cemented by some of our isolation testing in the compute layer.
Compute
This was the big scary one. We had no idea where to start so we started grasping at straws. Some of the things we tried initially were:
- Created a baremetal linux node and present two iSCSI volumes on it (Did not reproduce)
- Install KVM and run two VM’s on an iSCSI volume presented to the host OS (Did not reproduce)
- Create 2 VM’s on KVM that used a direct attached iSCSI volume to the VM (Did not reproduce)
At this point, we decided to focus in on VMware, and see what we could find. After some communication with NetApp support, we were told that vVol performance had been drastically improved in the latest version of ElementOS, and that we should upgrade. This had no noticeable effect on the problem. This did, however, give us pause on vVols in general, so we decided to try to isolate that down by trying the following tests:
iSCSI VMFS Datastore
We decided to present a traditional iSCSI volume, and create a VMFS datastore on it. Because we didn’t want to saturate the QoS policy, we created this artificially high so we wouldn’t hit it (5k,50k,200k) on the SolidFire. We then moved both VM’s to the VMFS and ran the same FIO test. Sure enough, we hit this problem again (See Footnote 1). So, we know it wasn’t a vVol specific problem.
iSCSI VMFS/vVol Split
At this point, we were trying to isolate some sort of issue at the network port layer (Drivers, Firmware, etc). So, we decided to put one VM on vVol and one on VMFS. We were unable to reproduce the issue here. So, that, for the most part, rules out anything with the network ports, or the general iSCSI path, since both of these still leverage iSCSI.
2 vVol Datastores
Grasping for straws, we created a 2nd vVol storage container on the SolidFire, and presented a secondary datastore and ran the test again. This, surprisingly, did recreate the latency. Maybe we’re back to vVols after all?
Getting to Root Cause
This started to feel a lot like a disk queuing problem on the ESXi host. What we didn’t understand though, was if it was a queuing problem, why were we able to recreate it if we had 2 vVol datastores?
We decided to go back to the drawing board and educate ourselves on how IO queuing works in ESXi. There were multiple presentations and blog posts from Cody Hosterman from Pure Storage that really helped us understand how queueing works (here, here, and here). Once we started to build an understanding, things started to make sense. However, one thing still really bugged us. Cody mentioned multiple times that 95% of users won’t need to touch ESXi queues. In fact, he illustrated that in order to need to hit performance impacts, you would need to hit 64k IOPS per volume, per host. However, we were hitting this with 3-6k IOPS.
ESXi is built for fairness. As near as we can tell, from a storage perspective, this fairness is predicated on the fact that if a storage device is experiencing latency, every VM on that device is going to experience latency.
SolidFire with vVol works differently though. In order to maintain QoS limits, SolidFire will inject latency on a per vVol level. In other words, if the vVol on VM A has exceeded it’s QoS policy, it will inject latency to the requests to slow it down.
We started to wonder if the combination of vVols and SolidFire introducing latency on a per vVol level was causing the problem.
We decided to take a look at each level of queues on the ESXi host, and figure out how they worked to better pinpoint where our problem was.
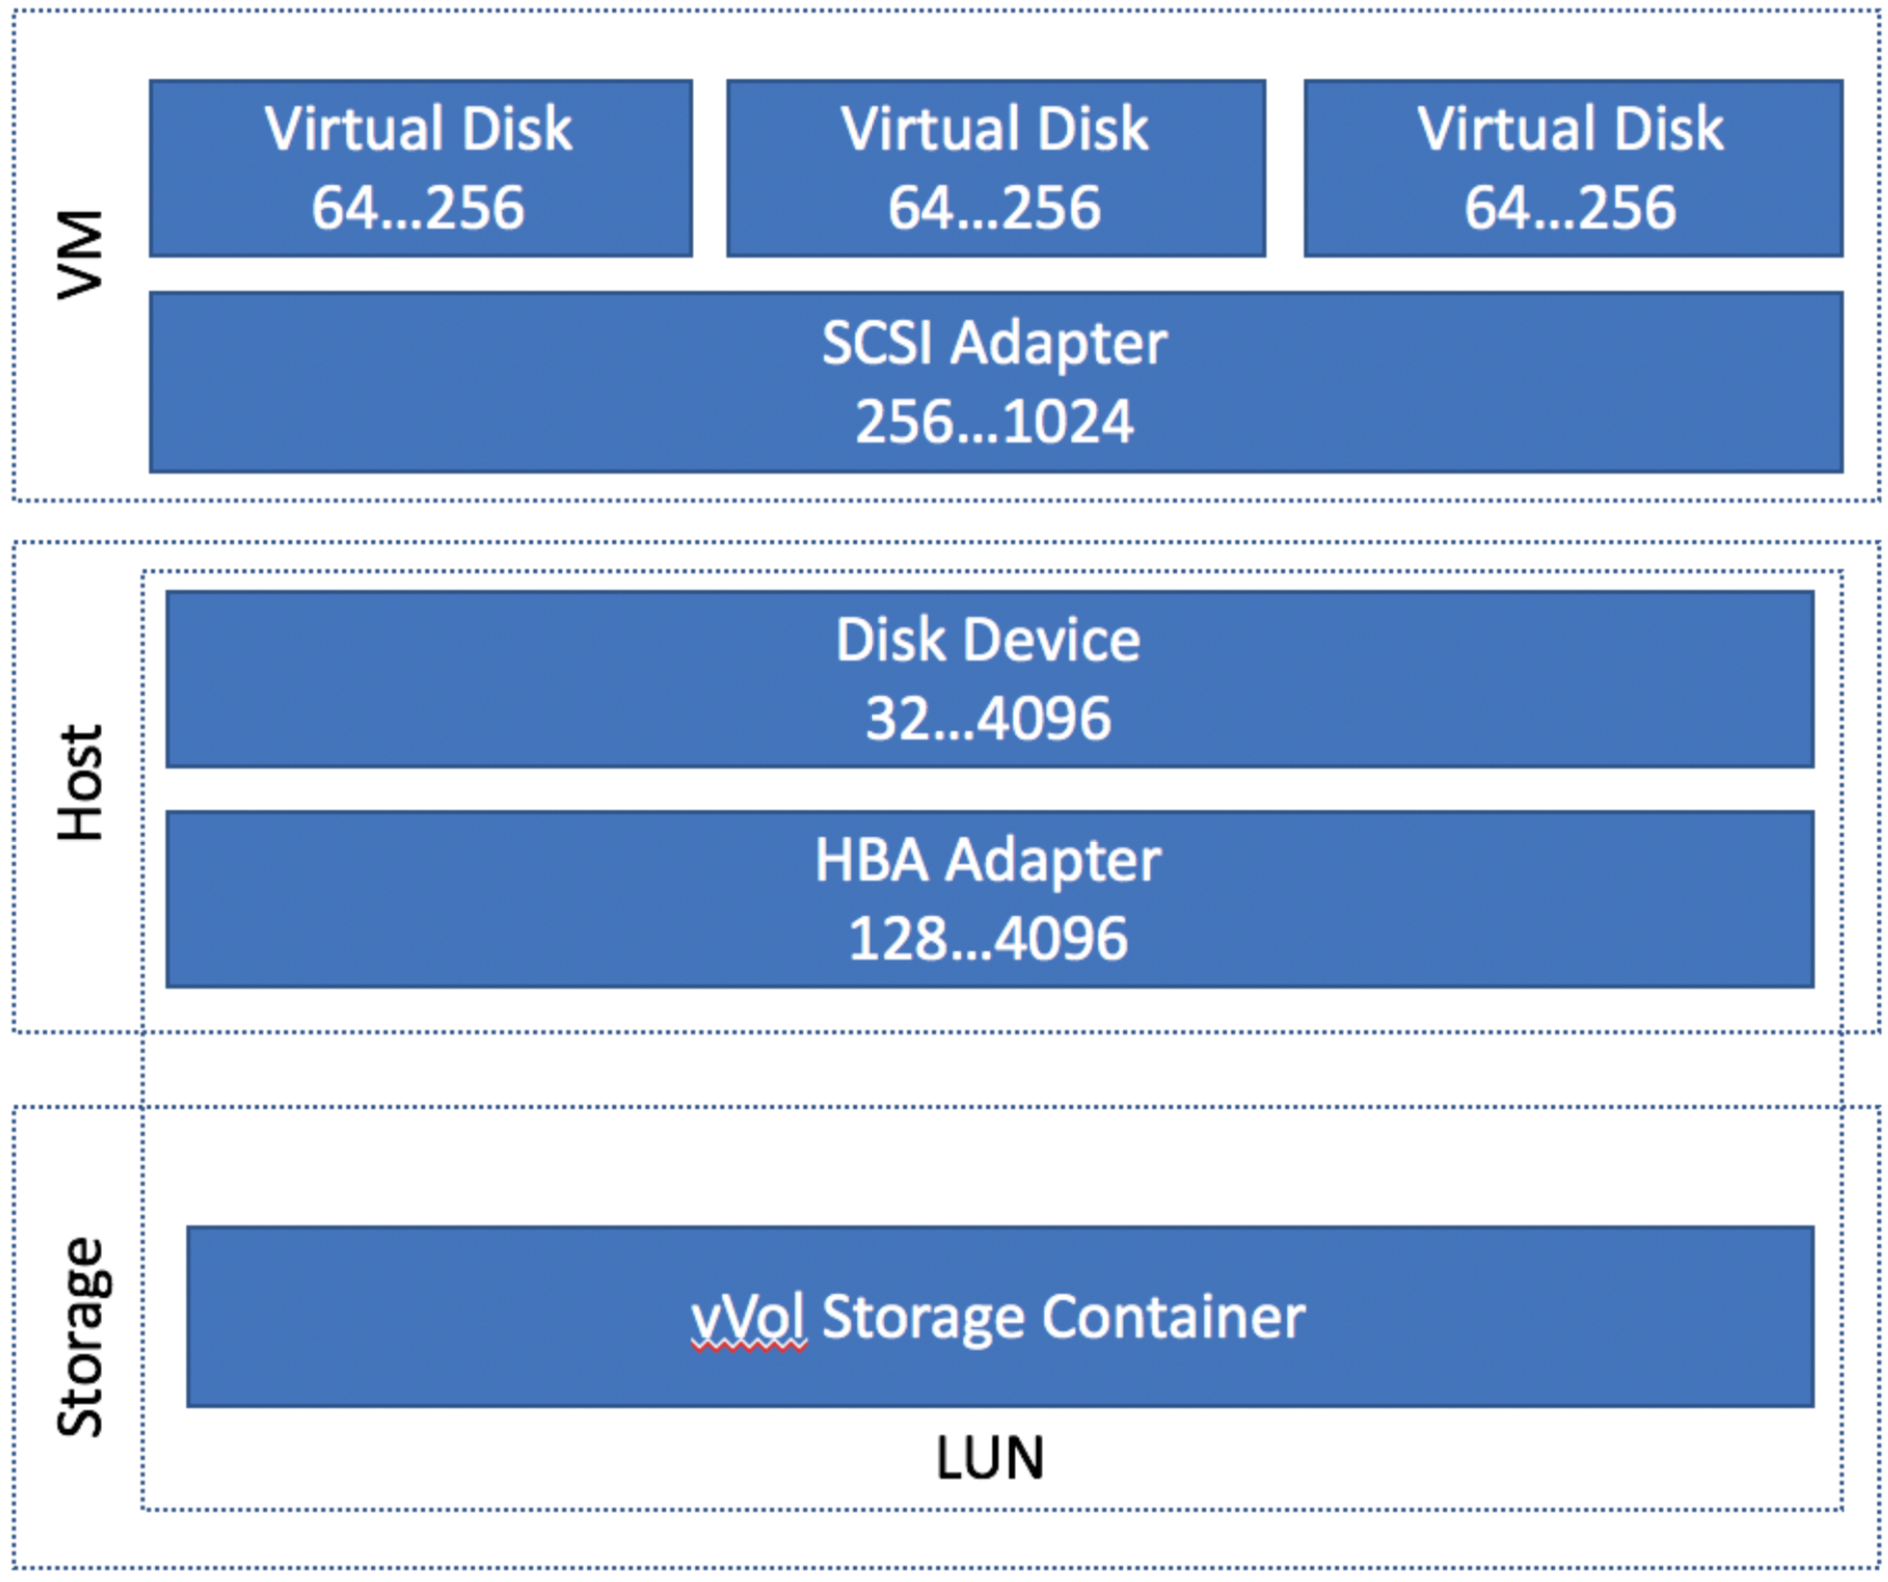
Let’s take a look at what we found on the most basic config. This is one ESXi host to one SolidFire node, with one vVol storage container only.
 ’
’
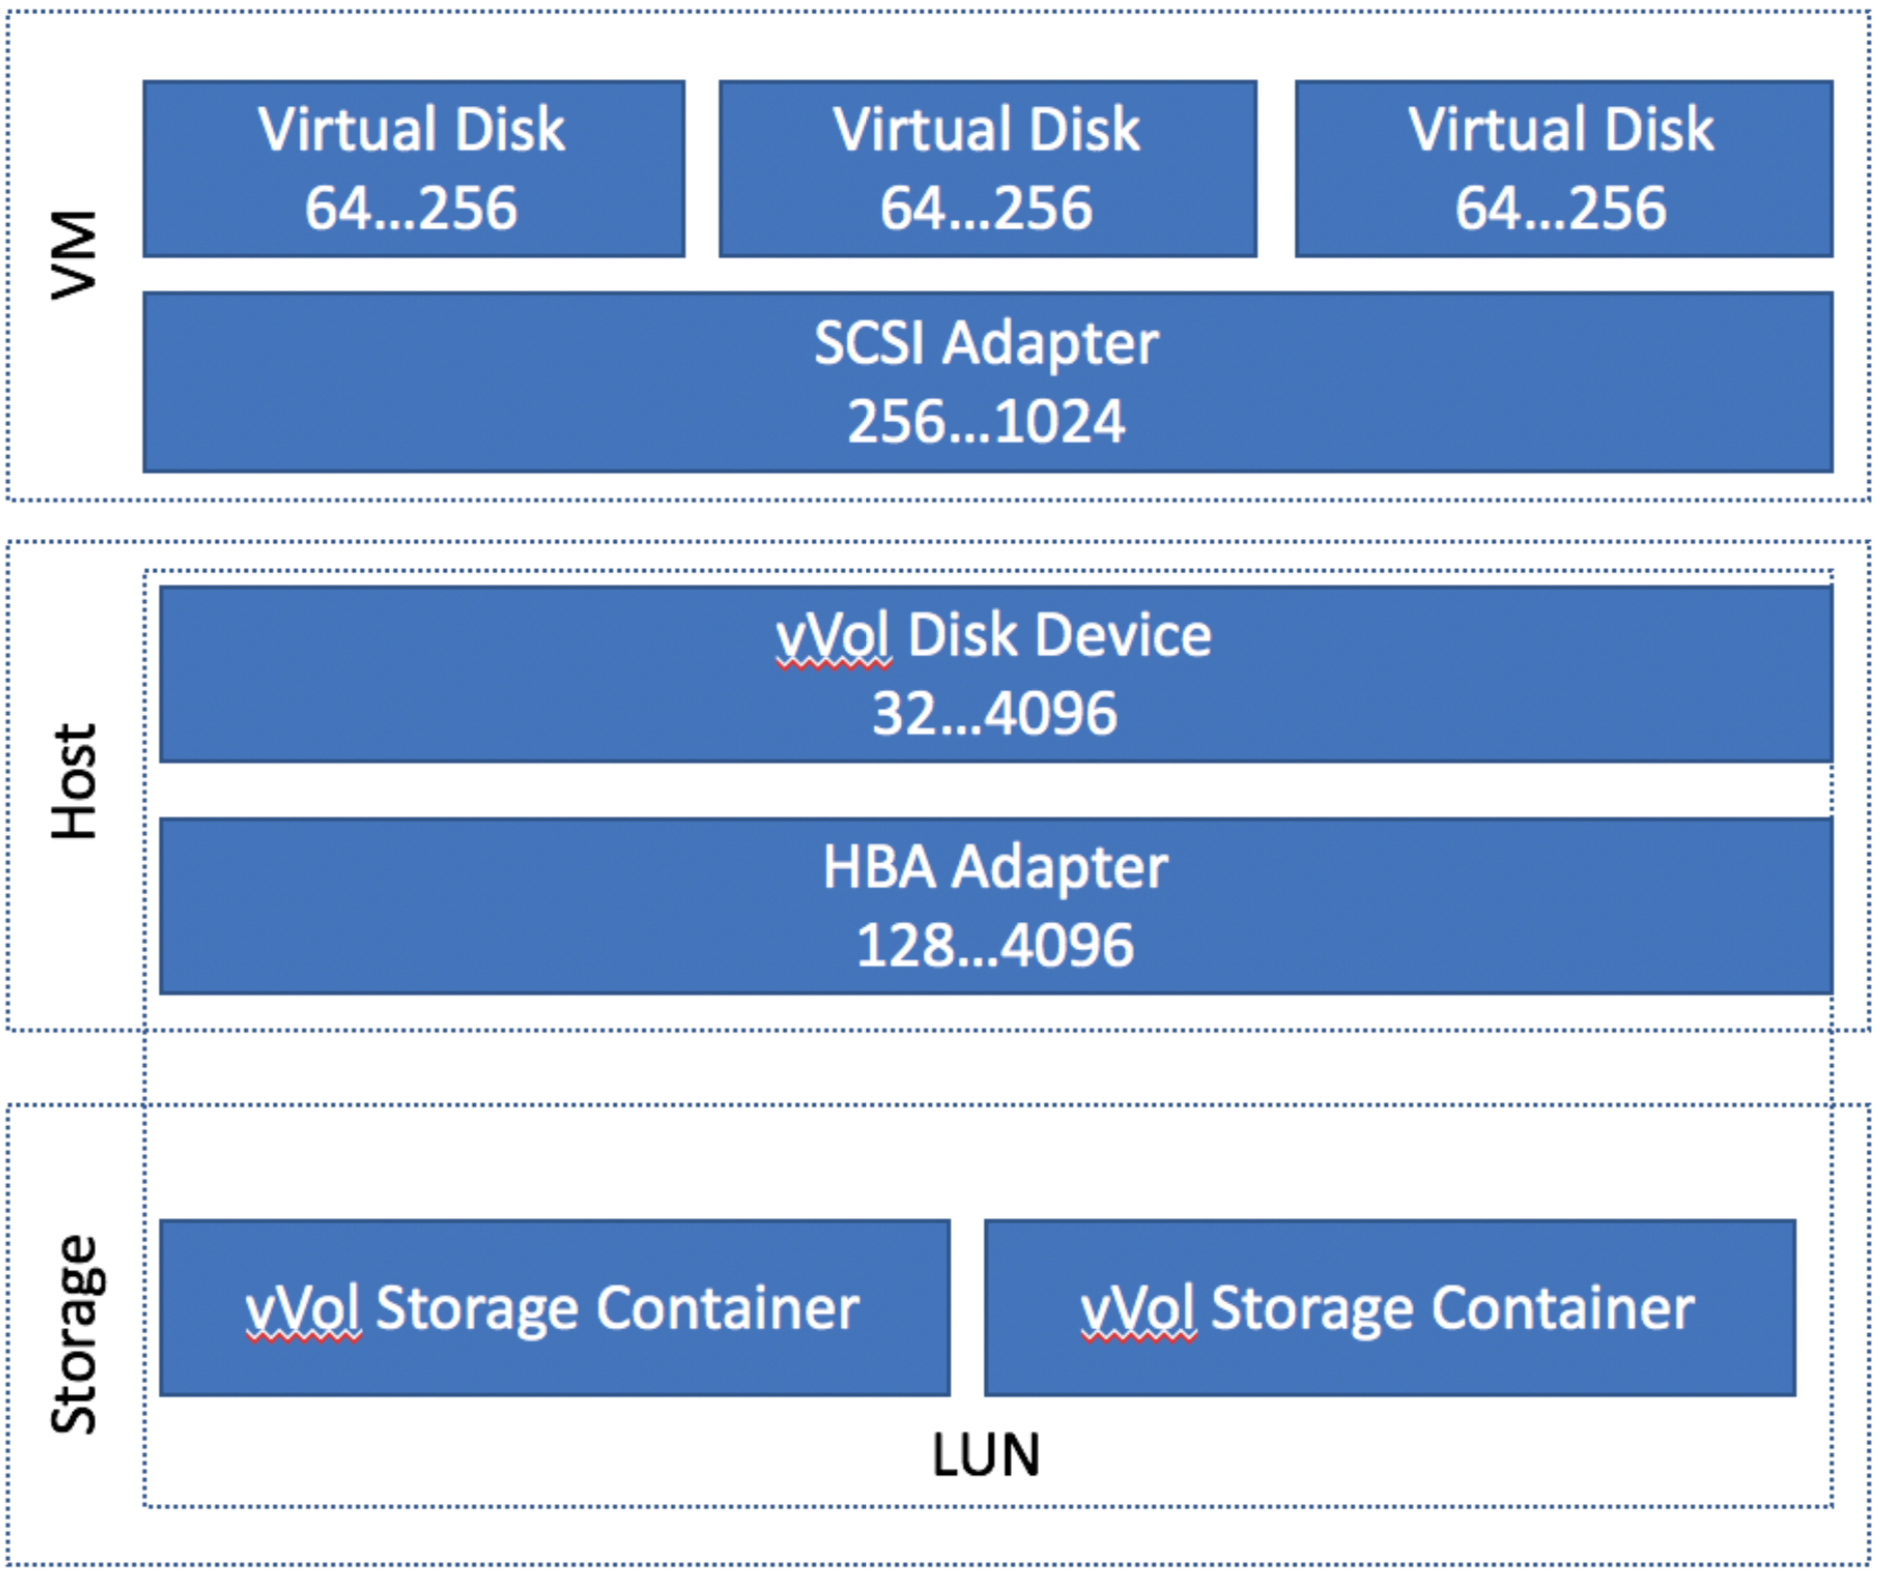
This diagram breaks it down in to three parts. The VM (the virtualized hardware), the host (the ESXi Host), and the storage cluster. The numbers on the left are the default queue depth, the number on the right is the maximum for that queue.
Looking at an individual VM, each VM has a default queue depth of 64, but the SCSI adapter can be 256. Let’s assume that our VM has one disk on it, so it’s maximum queue depth is 64. If the IO of the VM overwhelms that, the IO requests will be queued in the kernel.
The host gets a little bit tricky, and this is where most of confusion was coming from. The entire HBA adapter has a default queue of 128. Therefore, a single VM should not be able to overrun the queue. However, if the queue does get overrun, those requests would be queued in the ESXi kernel.
You can see this value in ESXTOP by pressing ‘u’.
 ’
’
However, the interesting part to us is that when we were running our tests, we were seeing the DQLEN for our device drop to 32. From our research, we knew that this was DSNRO kicking in, which effectively kicks in when more than one VM is trying to write to a single device. Effectively, this lowers the device queue to 32. In any real world scenario, this will almost always be enabled, especially the more VM’s you run on a host. This is intended to provide that fair scheduling we discussed for ESXi, so we didn’t think much about it. As a side note, the maximum here is the maximum queue for your HBA.
So, taking the same approach, let’s try to isolate the queues down.
VM Queues
We honestly didn’t spend much time here. We knew these queues were not shared. The thought crossed our mind that maybe we should set these really low and test, but I don’t recall that we ever actually did.
HBA Queue
This one we ruled out from a previous test. If this queue was causing issues, we would have been able to reproduce the issue when we had one VM on vVols and one on traditional VMFS since this is a shared queue.
DSNRO Queue
This one mystified us, so we set out to figure out how it worked and if it was a was the culprit.
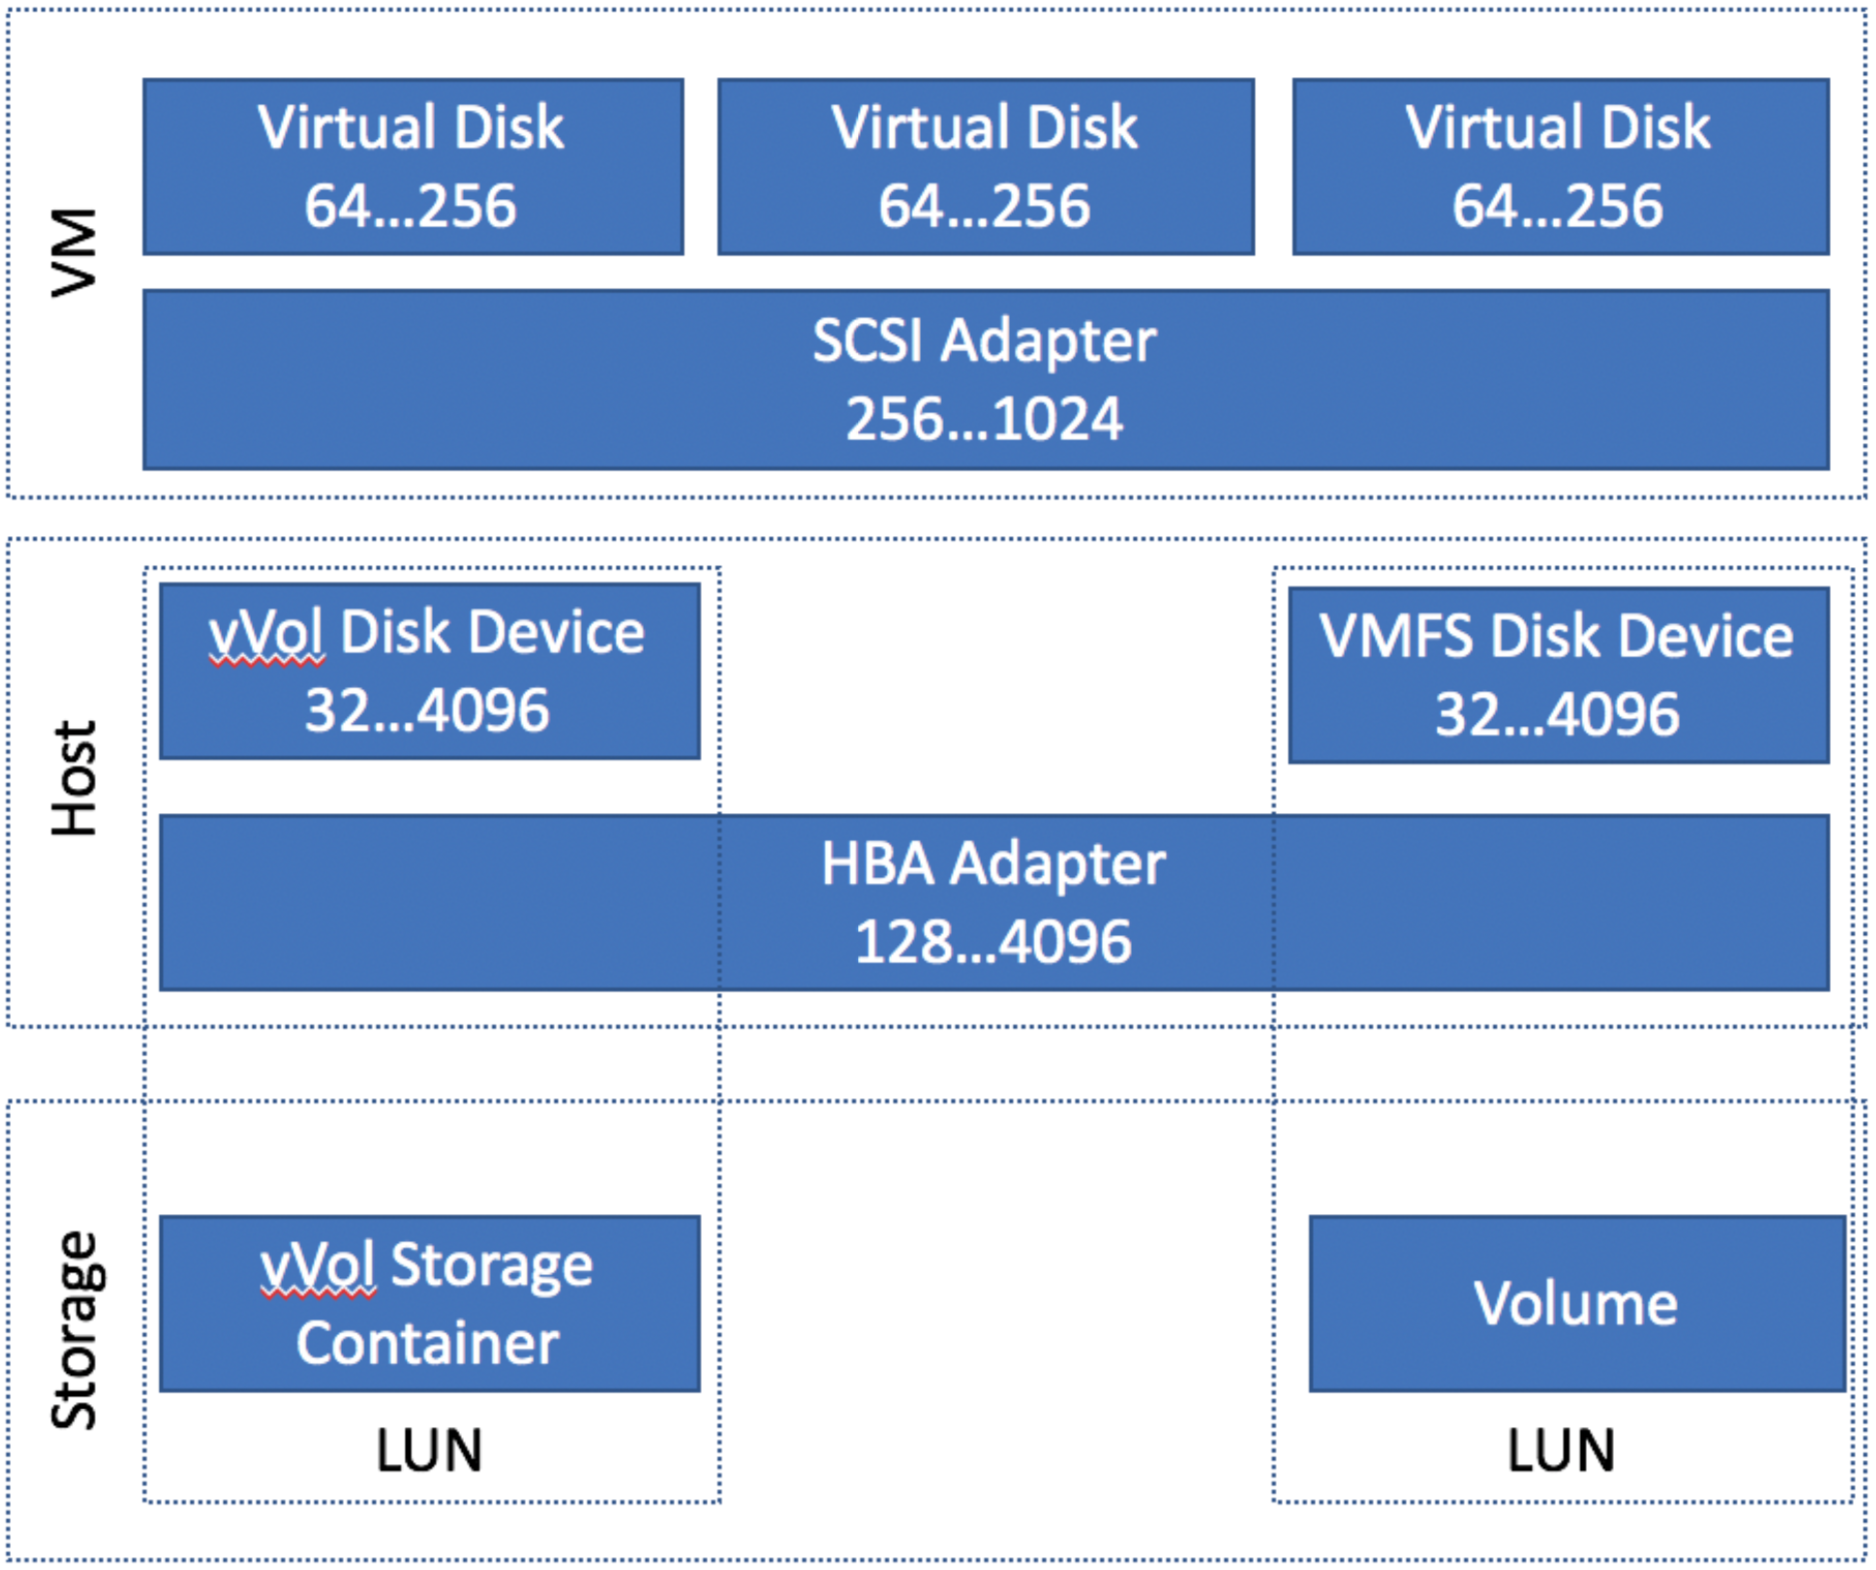
DSNRO is a per device queue. With a out split VMFS and vVol datastores configuration, you have two disk devices, which means 2 separate DSNRO queues:
 ’
’
You can see these two devices in the esxcli:
exscli storage core device List
Initially, we assumed with 2 separate vVol based datastores you would have two disk devices, but we decided to investigate this a bit further.
Surprisingly, when you create a second vVol container and create another datastore from it, it is still represented as a single disk device in ESXi, and therefore, a shared DSNRO queue across those datastores:
 ’
’
So there it is! We’ve isolated it down to a single shared component with a happy path (VMFS and vVol) and a sad path (2 vVols) where everything else is exactly the same.
Hypothesis of the Problem
We believe that having the DSNRO queue set to 32, it opens the possibility of a VM with a single disk could sending 64 requests (it’s max queue size), allowing a single VM to overwhelm this queue.
Typically, this is not a problem, as the DSNRO queue is designed to provide fair scheduling. This assume, however, that the latency of all requests will be (relatively) the same.
However, given that SolidFire is injecting latency on a per vVol level on the same disk device, it is possible for a single VM to saturate this queue with request that will all have latency injected, despite the fact that a second VM would have no latency injected. Because these VM’s share the DSNRO queue, this means that the good neighbors requests, which have no latency injected by SolidFire, could get stuck behind the bad neighbor VM, which has had latency injected.
Ultimately, we increased the HBA queue to 256:
esxcli system module parameters set -m iscsi_vmk -p iscsivmk_LunQDepth=256
and then, after a reboot, increase the DSNRO for each device to match at 256. In our lab environment, this was only a single disk device. However, in a production environment, this would be however many hosts you have in a your SolidFire cluster. On an initial cluster of 4 hosts, you would have to set this on 4 devices with the following command:
esxcli storage core device set -d naa.xxxxxxxxxxxxxxxxx -o 256
In addition to doing this, we implemented a few other best practice settings (which to our testing, didn’t have any impact on this problem) such as:
- Increasing the max io size to 512k to match the IOPS between SolidFire and Vmware for most workloads
esxcli system settings advanced set -o /ISCSI/MaxIoSizeKB -i 512 - Increasing the max transfer size to 16mb, which will help with clones/copies
esxcli system settings advanced set -i 16384 -o /DataMover/MaxHWTransferSize - Disabling Delayed ACK on the iSCSI adapter
Once these changes we all in, all latency issues from the bad actor VM’s have disappeared, and our latency even with a VM maxing out QoS dropped to ~1ms.
Lessons Learned
- IOPS QoS Policies on SolidFire is a sliding scale by block size. A Qos Policy with 3k IOPS means 3k 4k IOPS, or 77 512k blocks.
- ESXi will “chunk” IO Operations to 128k blocks by default. This appears to happen at the HBA layer, as ESXTop does not reflect the IOPS multiplier, but it is observed at the SolidFire layer.
- DSNRO is intended to protect VM’s in a situation in which multiple VM’s are writing to a single datastore.
Lingering Questions
- It seems that this is occurring because a single VM can saturate the disk device (DSNRO) queue. Why would we just not increase the HBA and Device queue to the maximum 4096 to ensure that we can’t overrun the queue?
- By Default, ESXi “chunks” 512k operations to 128k. What is the tradeoff to raising this to 512k like we did?
- Setting the DNSRO must be done per disk device. With SolidFire clusters, every time we add a new device, it’s going to appear as another disk device, and we’ll have to set this on every node consuming the NetApp. This is not scalable. Is there a better way to manage this? We could probably build an ansible module to do so, but given that it has to done via the CLI, that makes it difficult.
- Would multi-pathing help mitigate this or make it worse with the default commands? At first, we thought it would help, but it would still appear that a single VM could saturate all 4 paths. In production, we think it was actually somewhat mitigated because we were using fixed path, which pins a single VM to a single path (disk device). Therefore, it was only a subset of the VM’s on the hypervisor that were pinned to that same path.
- It is our understanding that we could not use multi-pathing since our target and initiators are in different subnets. Is there any plan to change this? Why is this a limitation.
Footnotes
- Looking back at this, I’m not sure how we were able to reproduce it with both VM’s on a single traditional VMFS datastore, unless we set the IOPS lower than I remember. This is worth investigating again, but ultimately lead us to finding the issue, so I’m happy it worked out this way.