Introduction
Kubernetes has a wonderful feature called horizontal pod autoscaling that allows scaling of pods in your deployment based on the load that the service is experiencing. Out of the box, it has the ability to watch CPU and Memory consumption and scale according to those metrics. What happens if you have a service that isn’t bound my CPU or Memory though?
For example, many applications rely on AMQP services (such as RabbitMQ) which are leveraged to pass messages back and forth between services. Wouldn’t it make more sense to scale the services based on the depth of a given queue instead of CPU or Memory? This makes a lot more sense, especially if you consider that the consumer of messages may not be CPU or memory bound at all. Basing your HPA off those metrics alone could actually cause more harm than good.
Luckily, Kubernetes allows you to create custom metrics which you can base HPA’s on. There are several blog posts about this (especially around http request rates), but it appears that it has moved so fast that even blog posts that are six months old are no longer working. Google also has some examples, but their examples leverage StackDriver. What if you are on-premise or multi-cloud and can’t be bound to Google services?
I’ve run across too many use cases where scaling pods based on queue depth would be incredibly useful, so I decided to focus in and get this working and share it with the world. After quite a bit of fiddling, I was able to get it working with a combination of Prometheus, the Prometheus Adapter, the RabbitMQ Exporter, and some sample RabbitMQ services I created.
Deployment
It’ll probably be easiest to deploy the demo first, then walk through each of the components so you can see them live if you wish.
Everything you need to deploy this demo can be located in the k8s-scaling-demo repo. There are a few requirements you will need in order to do this demo though:
- A Kubernetes Cluster with kubectl setup(minikube will be fine)
- Helm deployed to the K8S cluster and a local helm client (Instructions here)
- Support for HPA version v2beta2 (
kubectl get apiservices | grep "autoscaling")
To make this as easy as possible, I have included a deploy.sh script, which will deploy all the helm charts that are needed, as well as deploying a sample consumer of messages.
To get started, clone the repo the repo locally, then run the deploy script
./deploy.sh
This will deploy RabbitMQ, Prometheus, Prometheus Adapter, and a sample RabbitMQ python application.
In order to demonstrate the scaling, the sample python application has two components, a publisher and a worker, which were based off the RabbitMQ tutorials. The publisher will be run adhoc and will publish the number of requested of messages in to the the RabbitMQ server with a random number of periods (between 2 and 10) in the message. The worker will then pull the messages off the queue, and sleep one second for each of the periods that in the message. This was done to simulate handling an event that is not CPU or Memory bound (such as making an API call, performing a SQL query, etc).
Initially, the deployment script will deploy the application with only 1 worker pod, but does have a HPA already configured to scale based on queue depth, which will explore later.
Once it’s deployed, you can work through the workflow below, which will walk you through each component and how it’s configured to make automatic scaling work.
Workflow
Let’s take a look at all the components that go in to this demo and the workflow:
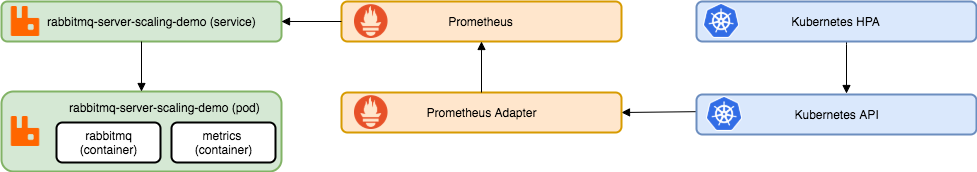
RabbitMQ Server, Exporter, and Sample Applications
At the heart of this demo is the RabbitMQ service, which is a typical deployment based on the RabbitMQ helm chart from Bitnami. There is a unique aspect to this deployment though, and that is the addition of the RabbitMQ Exporter. This runs as the “metrics” container inside of the RabbitMQ pod, and it’s purpose is to export metrics from RabbitMQ via HTTP in a format that Prometheus can “scrape” to collect data.
With the helm chart for RabbitMQ, it’s very easy to enable this as part of your values file
metrics:
  enabled: true
  port: 9090
Let’s take a look at the RabbitMQ management page by using port-fowarding to access the RabbitMQ management and metrics exporter page:
kubectl port-forward -n rabbitmq-scaling-demo svc/rabbitmq-server-scaling-demo 15672:15672 9090:9090
With a browser, you can now access the management page at http://127.0.0.1:5672. The username is admin-demo and the password is dynamicscale123!
When you initially log you, in you won’t see any much, as we haven’t created any queues or published any messages. Let’s go ahead and do that now by running the following:
kubectl run publish -it --rm --image=theryanbaker/rabbitmq-scaling-demo --restart=Never publish 50
This will run a pod on our Kubernetes cluster that publishes 50 messages in to the “task_queue”. Now, you can click on the “Queues” tab and you’ll see that there was a queue named “task_queue” created, and it should have some messages in it.
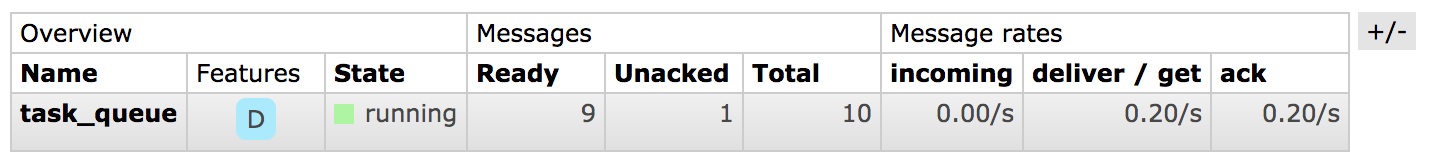
The number may now be less than 50 that we published because the worker pod that we deployed earlier is consuming the messages. You’ll also actively be able to see the number falling as the worker pulls messages off the queue.
Let’s also take a look at the RabbitMQ Exporter, which can be viewed at http://127.0.0.1:9090/metrics. A whole bunch of metrics will be returned which are all exposed in a format that Prometheus knows how to scrape and understand. If you do a search on the page for “task_queue”, you can see all the metrics related to the queue we created and published messages to above.
The metric we care about looks like the following:
# HELP rabbitmq_queue_messages Sum of ready and unacknowledged messages (queue depth).
# TYPE rabbitmq_queue_messages gauge
rabbitmq_queue_messages{durable="true",policy="",queue="task_queue",vhost="/"} 40
This is the total number of unprocessed messages in our queue “task_queue”. This will be the metric that we’ll use to scale pods on.
Take a look around, there are a ton of awesome metrics that the exporter exposes!
Prometheus
If you aren’t familiar with Prometheus, it’s a monitoring system based on a time series database that has become the standard tool to use to monitor both Kubernetes, as well as the workloads running inside of it. While discussing all the features of Prometheus is outside the scope of this blog post (maybe in the future?), I highly encourage you to check it out if you haven’t already. Coupling this with Grafana can give you insanely powerful visibility in the health and status of both your Kubernetes cluster applications.
For the purpose of this blog post, we’re going to leverage Prometheus as the collector of the metrics from the RabbitMQ exporter and in turn, the endpoint that the Prometheus Adapter will use to expose the metrics via the Kubernetes API.
It’s already been deployed as part of our deployment, so let’s take a look at it by using port forwarding again:
kubectl port-forward -n rabbitmq-scaling-demo service/prometheus-scaling-demo-server 8080:80
Once that’s running, let’s take a look at the console at http://localhost:8080/graph.
The landing page won’t have much on it, as we have to query for the metric we are interested in, so lets do that. In the query box, enter the following query in order to see the data it has collected:
rabbitmq_queue_messages{kubernetes_name="rabbitmq-server-scaling-demo",kubernetes_namespace="rabbitmq-scaling-demo",queue="task_queue"}
Once that’s entered, execute the query and the go to the graph page to view the historical number of messages in the queue. You should see something like this:
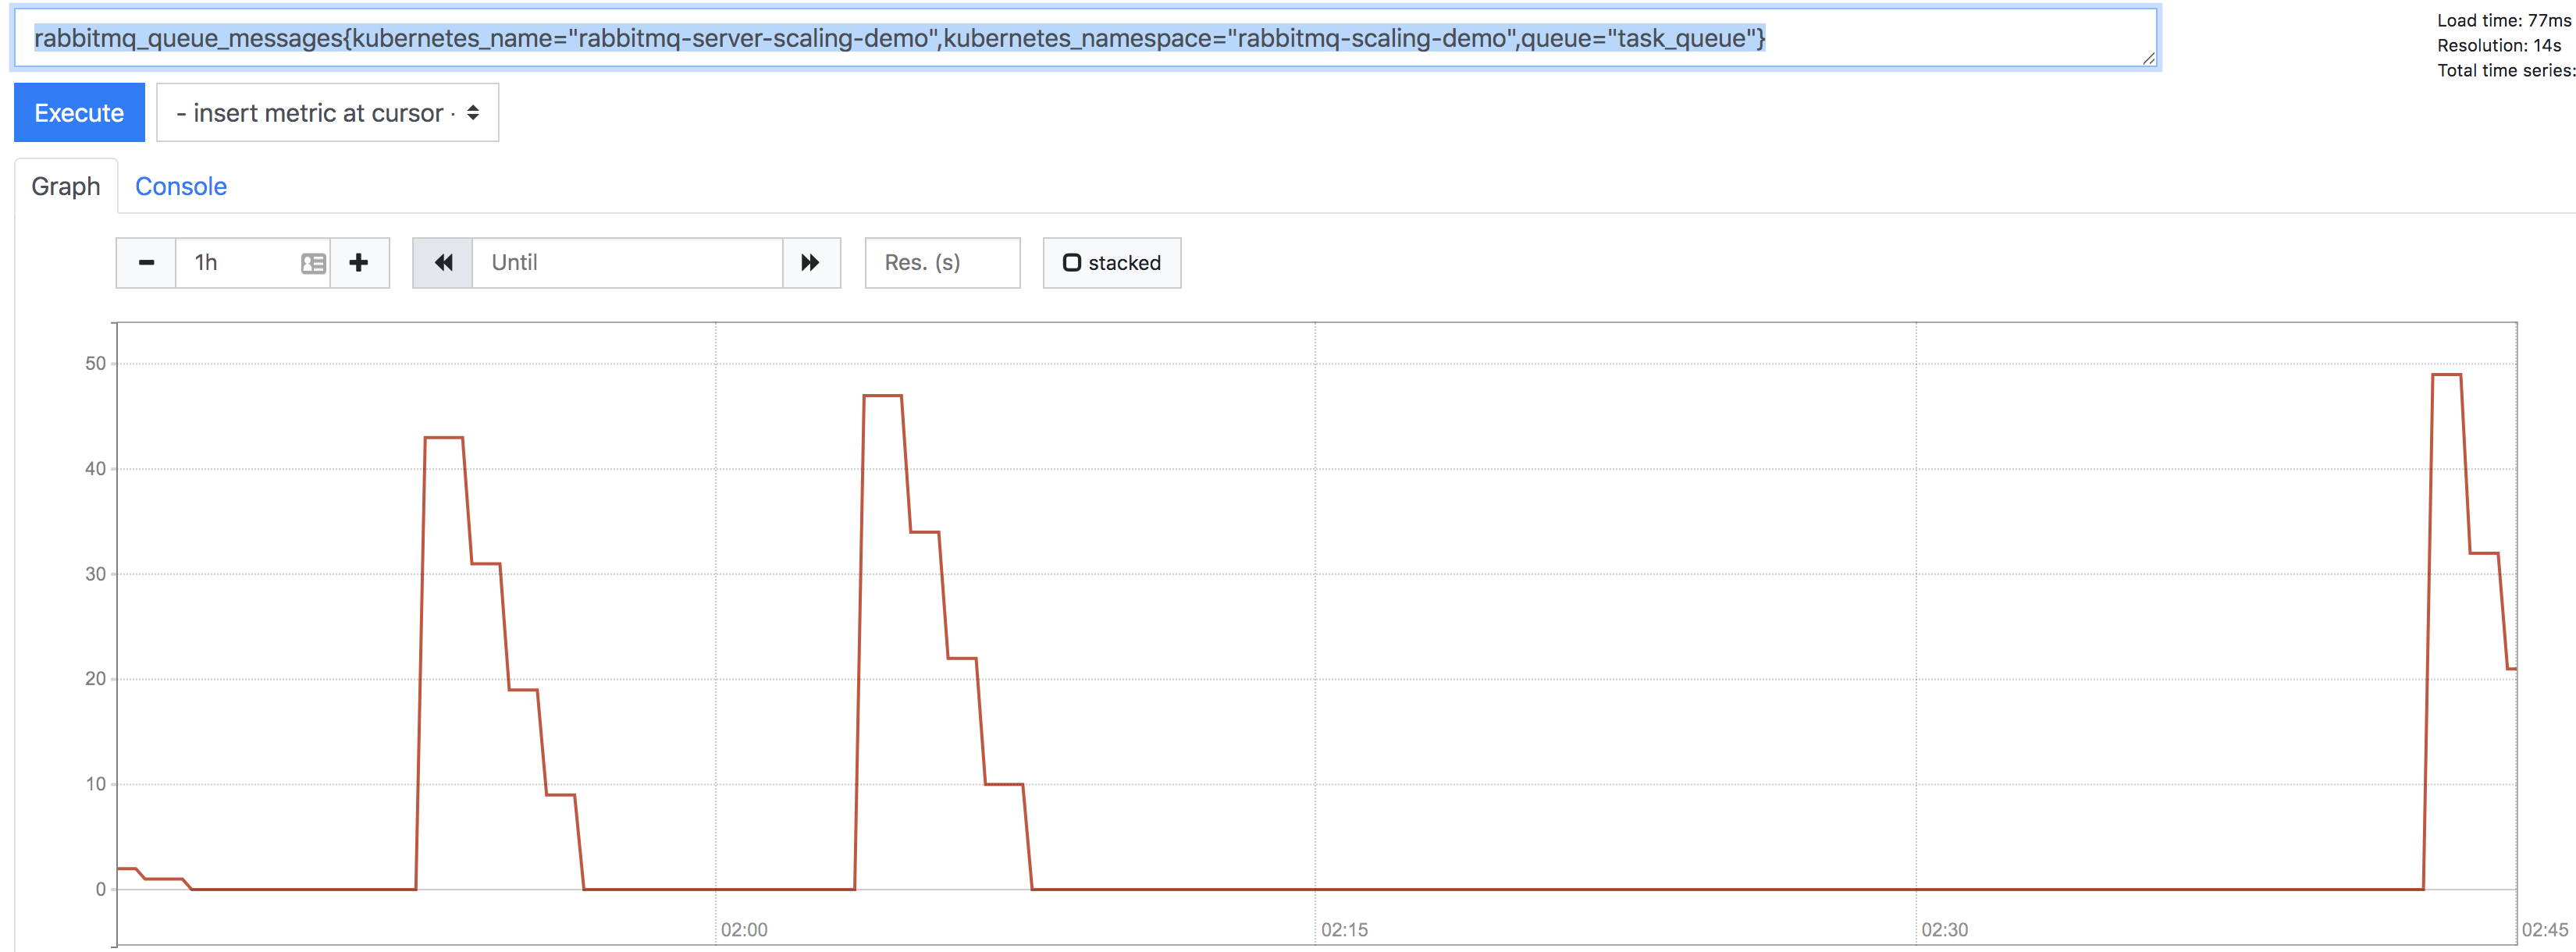
You can see from the graph that I’ve published 50 messages a couple of times, and slowly the worker node processed those messages out of the queue.
But how did Prometheus know to collect that data? That’s where the magic comes in. With Kubernetes, Prometheus can query the Kubernetes API for resources (such as pods and services) that it should try to “scrape” metrics from. This is done by adding annotations on to the resource. Let’s take a look at the RabbitMQ-server service:
➜ ~ kubectl get service rabbitmq-server-scaling-demo -n rabbitmq-scaling-demo -o yaml
Which gives us the following (abbreviated):
apiVersion: v1
kind: Service
metadata:
  annotations:
    prometheus.io/port: "9090"
    prometheus.io/scrape: "true"
...
As you can see, there are annotations that tell Prometheus that this resource should be scraped, and which port to scrape it on. From there, Prometheus handles the rest. Magic right?
Prometheus Adapter
We’ve established that Prometheus will gather the metrics from RabbitMQ and store it in it’s time series database, but there has to be a mechanism which will enable those metrics to be accessible from the Kubernetes API. This is where the Prometheus adapter comes in.
Essentially, the Prometheus adapter is an intermediary between the Kubernetes API and the Prometheus API. You configure the adapter on what Prometheus metrics you wish to expose to the K8S API, and how to interpret those metrics.
Out of the box, the Prometheus Adapter comes with a ton of pre-canned “rules” for exposing metrics from Prometheus to the K8S API. However, for simplicity, this demo disables all of the out of box configurations and only configures a rule to gather the number of messages in a given RabbitMQ queue. Let’s take a look at that configuration we deployed earlier located within the Helm Charts values file for the prometheus adapter:
- seriesQuery: 'rabbitmq_queue_messages{kubernetes_name!="",kubernetes_namespace!=""}'
  resources:
    overrides:
      kubernetes_namespace: {resource: "namespace"}
      kubernetes_name: {resource: "service"}
  metricsQuery: sum(<<.Series>>{<<.LabelMatchers>>,queue="task_queue"}) by (<<.GroupBy>>)
This was built by walking through the configuration demo. I highly suggest walking through it to get a better understanding of the configuration. I’ll walk through it briefly but I certainly won’t do it justice.
The first part of the query is the “seriesQuery”, which basically instructs the adapter which series of the data we are interested in. We also limit the namespace and name of the service here. Take a look at the query we executed against Prometheus earlier:
rabbitmq_queue_messages{kubernetes_name="rabbitmq-server-scaling-demo",kubernetes_namespace="rabbitmq-scaling-demo",queue="task_queue"}
Our configuration tells the Prometheus adapter to gather all series for data for the metric named “rabbitmq_queue_messages” metric where the labels on the metric for kubernetes_namespace and kubernetes_name (of the service) are not empty.
Because kubernetes_namespace and kubernetes_name don’t align with the actual name of the kubernetes resources (which would be just namespace and name), the “overrides” maps the Kubernetes resource to the label we want to query Prometheus. To get a complete list of Kubernetes resources to help you map the labels on the metrics to Kubernetes resources, you can run the following:
kubectl api-resources
The final part of the configuration is the query, which tells the adapter the query to run on Prometheus to gather the data. The adapter will replace the “series” variable with rabbitmq_queue_messages and the “LabelMatchers” variable with the label selector and values for kubernetes_namespace and kuberentes_name. The values for the selectors will be filled in later when we do the HPA, so just hang tight on that.
You may be asking yourself, can’t we just variablize the queue too? I would say yes, and the documentation would indicate as much, but I haven’t had any luck getting that to work so I’m just manually entering it in the configuration. This isn’t optimal because you’d have have to have a rule in the configuration for each queue that you are want monitor for scaling. Maybe soon I’ll get back to variablizing that part too…
The configuration has been applied by our Helm chart, but let’s take a look at some of components in Kubernetes that makes this all work. This will also prove very useful if you need to troubleshoot any of the components.
First off, let’s look at the new API service that the Prometheus adapter created:
kubectl get --raw /apis/custom.metrics.k8s.io/v1beta1
Which results in the following output:
{
  "kind": "APIResourceList",
  "apiVersion": "v1",
  "groupVersion": "custom.metrics.k8s.io/v1beta1",
  "resources": [
    {
      "name": "services/rabbitmq_queue_messages",
      "singularName": "",
      "namespaced": true,
      "kind": "MetricValueList",
      "verbs": [
        "get"
      ]
    },
    {
      "name": "namespaces/rabbitmq_queue_messages",
      "singularName": "",
      "namespaced": false,
      "kind": "MetricValueList",
      "verbs": [
        "get"
      ]
    }
  ]
}
You can see that a resource was created for both of our series qualifiers we defined earlier (services and namespaces).
We can use this information to query our new custom metrics API to make sure everything is working before we try to build an HPA for it:
➜ ~ kubectl get --raw /apis/custom.metrics.k8s.io/v1beta1/namespaces/rabbitmq-scaling-demo/services/rabbitmq-server-scaling-demo/rabbitmq_queue_messages?metricLabelSelector=queue%3Dtasks_queue
Which results in the following:
{
  "kind": "MetricValueList",
  "apiVersion": "custom.metrics.k8s.io/v1beta1",
  "metadata": {
    "selfLink": "/apis/custom.metrics.k8s.io/v1beta1/namespaces/rabbitmq-scaling-demo/services/rabbitmq-server-scaling-demo/rabbitmq_queue_messages"
  },
  "items": [
    {
      "describedObject": {
        "kind": "Service",
        "namespace": "rabbitmq-scaling-demo",
        "name": "rabbitmq-server-scaling-demo",
        "apiVersion": "/v1"
      },
      "metricName": "rabbitmq_queue_messages",
      "timestamp": "2019-10-04T14:10:31Z",
      "value": "0"
    }
  ]
}
The results of the above kubectl (especially the “describedObject”) command proved very helpful when building out the HPA, so let’s take a look at that next.
HPA
The final piece of the puzzle is the HPA that is defined. This will give Kubernetes the information of what target to scale, and when to scale it.
Let’s take a look at our configuration for the hpa:
apiVersion: autoscaling/v2beta2
kind: HorizontalPodAutoscaler
metadata:
  name: rabbitmq-server-scaling-demo-hpa
spec:
  scaleTargetRef:
    apiVersion: extensions/v1beta1
    kind: Deployment
    name: worker
  minReplicas: 1
  maxReplicas: 50
  metrics:
  - type: Object
    object:
      metric:
        name: rabbitmq_queue_messages
      describedObject:
        apiVersion: "/v1"
        kind: Service
        name: rabbitmq-server-scaling-demo
      target:
        type: Value
        value: 100
The scale target section should be familiar, as it’s the same as HPA’s based on CPU or RAM metrics. It tells the HPA the exact path to the target that should be scaled. In our case, it’s the worker deployment, which consumes messages from RabbitMQ.
The metrics section introduces the “Object” type, which will be leveraged for custom metrics. I honestly struggled with getting this working until I realized that the information that it wanted was a direct reference to the “describedObject” from the Prometheus Adapter.
Finally, our target is set to 100, which means that the HPA should scale the deployment to ensure there is 1 pod for every 100 messages in the queue. Let’s try this out!
First, let’s look at the current state of the HPA. Assuming you have been diligently working through this blog post, paying attention to every single detail, the single worker node should have worked through all the messages we published earlier.
➜ ~ kubectl -n rabbitmq-scaling-demo get hpa
NAME                               REFERENCE           TARGETS   MINPODS   MAXPODS   REPLICAS   AGE
rabbitmq-server-scaling-demo-hpa   Deployment/worker   0/100     1         50        1          2d9h
As you can see, there is only 1 worker because there is not currently any messages in to the queue.
Let’s max this thing out and see what happens by running our publisher to inject 5000 events. Remember, we set the scaling to 1 pod per 100 messages, and our max pods to 50. So, if all goes well, this should max our pods out:
➜ ~ kubectl run publish -it --rm --image=theryanbaker/rabbitmq-scaling-demo --restart=Never publish 5000
Wait a few minutes, then check out the HPA again:
➜  ~ kubectl get hpa
NAME                               REFERENCE           TARGETS    MINPODS   MAXPODS   REPLICAS   AGE
rabbitmq-server-scaling-demo-hpa   Deployment/worker   4987/100   1         50        50         2d10h
Boom! 50 pods have been launched to handled the load!
Wrap up
I hope this helps everyone! Feel free to run the destroy.sh script to cleanup up all the resources we created.
If you any any issues at all, feel free to comment here or reach out to me via one of my linked social media accounts!